

There are many software and tools that enable you to analyze your site, the most famous of which is the traditional Google Analytics tool, which tracks traffic on your site and shows you information such as how users reach your site, the pages they view, and how they move from one page to another. But the Google Analytics tool requires some experience to understand it and track the meanings of the data in it, and it may not provide you with all the necessary data that helps you make improvement decisions on your site.
In today’s article, we will discuss the concept of a heatmap, also known as a heatmap, which is an effective and easy-to-understand way to understand users’ behavior on your site’s pages. This map enables you to identify visitors’ movements within your site, where they go when they first enter the site, where they click on the home page, what their scrolling patterns are, and which sections receive a lot of attention. All of this in a visual way that is easy for you to understand and make decisions based on, which will improve the use of your site and increase conversion rates and sales on it.
Therefore, if you are a website owner and want to know which areas receive the most attention from visitors to your site, this article will definitely benefit you. In this article, we will provide you with a comprehensive explanation of the concept of heatmaps, their types, and methods for collecting data through them. Then we will introduce you to the best WordPress plugin that enables you to include these maps on your site.
What is a heat map ?
Heat maps, in general terms, are a visual representation of data, in which different data values are depicted by color to facilitate the process of quickly visualizing and understanding complex data.
The concept of heat maps is used on websites (Website Heatmaps) to depict site elements in the following colors according to their temperature, that is, according to their prevalence and use by site users (red, orange, yellow, green, blue), hence their name as heatmaps.
The term “Heatmap” consists of two words, the first is Heat, which indicates the amount of activity on the page or button. When a button or part of the page is highlighted in red, this indicates a high rate of activity on it, and the second word is Map, which is It is used to explain the behavior of visitors on website pages.
Heat maps provide website owners with important analyzes that help them identify visitors’ behavior within their site pages. They are often used in online stores and sales pages to detect visitors’ movement within the store or landing page .
It highlights the places with the highest activity rates on the site (the hottest) in red, which indicates that this part or button is clicked frequently by visitors. The places with the lowest rate of activity (the coolest) are highlighted in blue, which shows that these parts are not used by visitors, and the rest of the parts are in different color gradations according to their temperature (i.e. according to the rate of activity of visitors in them). According to these analyses, you must improve the site.
Through these improvements, a better user experience will be obtained, which will be reflected in sales and conversions. Heat maps are closely linked to improving the user experience and exploring the deficiencies found in the design of the site pages. For example, through them it is possible to reveal the reason for the decrease in sales in the store. The purchase or basket button is invisible or confusing to the visitor, for example, so he does not click on it in the first place.
In addition, these maps show you the locations of clicks, and give you a comprehensive overview of the visitor’s movements from the time he entered the page until he left it, by tracking the movement of the mouse and scrolling within the page itself. It has custom tools that you can install on your website, but before that, let’s learn about its usefulness.
You can embed heat maps on your site through a JavaScript file that is uploaded to the site server, or by using a custom add-on for that.
Benefits of heatmaps
Heatmaps give you a deep understanding of how visitors interact with your website pages, and help you solve problems related to conversion, sales, etc. by learning about visitor behavior by answering questions like:
What content interests visitors?
Heat maps provide you with a comprehensive analysis of the buttons and sections most used by visitors. For example, you can determine which home page sections or article categories are frequently clicked on, and show you the excerpts that are of interest to visitors within the article itself by tracking the user’s movement and whether he scrolled to Below the article or not.
Do visitors click certain buttons more than others?
Heatmaps, as mentioned earlier, provide a comprehensive analysis of visitor behavior. By looking at the analytics, you will identify the buttons that are frequently clicked by visitors, which are in red, and the buttons that are ignored, which are in blue, and then identify the reason for this behavior, as perhaps the button is not visible to users.
Do visitors complete reading all of the page content?
You can find out this through scroll maps, which are a type of heat map that gives you a comprehensive view of the visitor’s scrolling behavior. What is meant by scrolling behavior is knowing what content the visitor is viewing and what parts he is heading to when entering the site page. It also determines whether the visitor scrolls to the end of the pages to see all their contents or not.
What is the first thing that attracts a visitor when he enters a specific page?
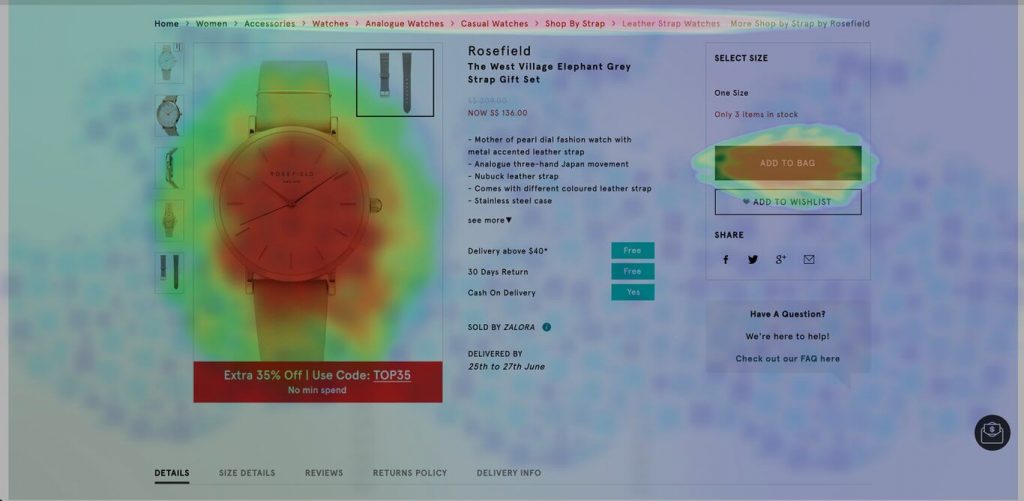
You can find out what attracts visitors to your site by highlighting the most frequently clicked buttons and sections of the site. This helps you identify the content that attracts visitors more than others. For example, in the following image, you find that one of the buttons on the page is marked in red, which means that this button attracts a lot of visitors’ attention.
Make decisions to improve your site
Heat maps help you make decisions that will improve your site, based on the data that the maps collect from the use of your site by visitors. Based on this data, you can update or redesign pages to suit visitors’ behavior. If you find, for example, that a certain button on the site is not clicked because it is hidden or not clearly visible to visitors, you must make a decision to improve it to make it more visible and easy to access (by modifying its shape, enlarging its size, or changing its color to increase attention to its presence and raise the rate of access to it).
Providing an easy and comprehensive way to identify visitor behavior
There are many digital analytics tools, but most of them are complicated to use or do not give you a complete view of visitors’ interaction with your site. For example, Google Analytics provides you with information about the demographic composition of your site visitors, bounce rate, etc. But if you want to know the reason for the bounce rate, then Google Analytics will not provide you with any answer. But heat maps can clearly show you whether the visitor is distracted, or does not find the content that interests him on your site, so he does not click on any section of the home page, or the site does not work as expected on mobile phones.
How do I make Heatmap work on my site?
There are two ways to activate heat maps and make them work on your site:
The first method: through a JavaScript file. You can insert appropriate code yourself into your site’s code to track user data and send it to your site’s server , and enable you to compile this data in the form of a heat map to get the final visualization of the behavior of your site’s users. With the necessity of writing the necessary code to ensure that the users being tracked are unique users, so that you do not get duplicate data.
The second method: Through ready-made plugins. There are many WordPress plugins that enable you to collect site-specific analyzes and display them using the heat map method, which we will discuss in the subsequent paragraphs. In this case, you monitor your site’s analytics through a built-in control panel in addition to providing you with all the information. required.
Types of heat maps
1- Scroll maps
Scrolling maps represent the scrolling pattern of site users, in order to understand the places and parts that users navigate to and from. This map also shows you whether the page length is appropriate or not. When the lower areas of the page have a low activity rate (green or blue), this means that visitors do not complete browsing the page until the end.
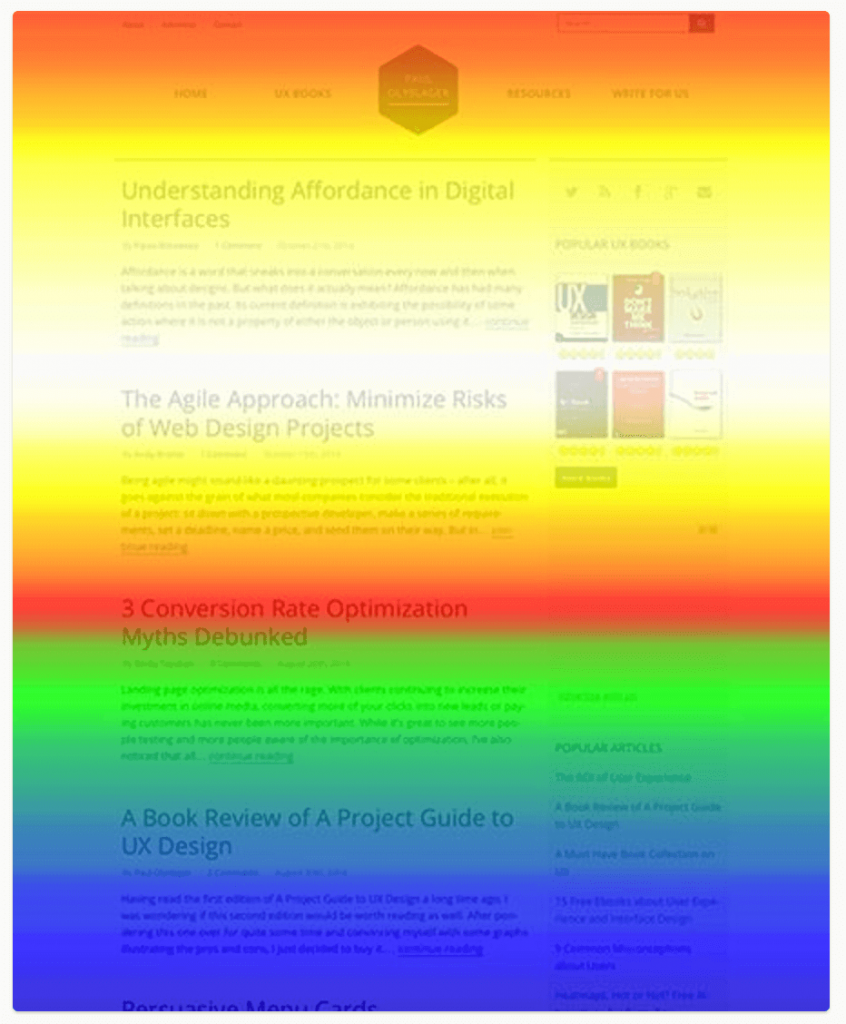
This is why you must identify the reasons that lead the visitor to close the page and not complete browsing it until the end. There may be an annoying image, or unreadable text on this page, or the length of the page is not appropriate as we mentioned previously, or perhaps the visitor is unaware that there is content at the end of the page.
2- Click tracking heatmaps
Click tracking maps are the most common and used by website owners. These maps show where users click on sections or buttons of the page, as shown in the following image. When you look at this image, you will find areas in red (the places where visitors click the most) and other areas in green and blue (the places where the click rate is low).

This type of map can be used to track clicks on sections and sales pages to find out which section is of most interest to users, and then focus on it. It can also be used within the sales page itself as well, in order to know whether visitors view product specifications before purchasing or go to the payment processing page directly.
3- Mouse tracking heatmaps

Through user tracking maps, it is possible to track the movement of the mouse while moving between the folds of the web page, as shown in the previous image. The red colored dots in this image represent the parts where the cursor is moved frequently by visitors. This allows you to identify the places that visitors search or view more than others.
However, it should be noted here that the information in this map may not be considered as reliable as in other types of heat maps. Scrolling or attention cannot always be linked to the movement of the mouse. Just because the mouse button has been on a title for 5 minutes does not mean that the visitor is still reading that title. It is not necessary that the visitor always looks at the place where the mouse cursor is.
Heatmap plugins for WordPress sites
There are many WordPress plugins that allow you to track visitors’ journey on your website pages, and some of these plugins provide you with additional features such as opinion polls and asking customers why they did not perform a certain action. Below we explain to you the most important of these plugins:
Add CrazyEgg
The CrazyEgg plugin was developed by Neil Patel. This plugin is activated on your site by adding a script to your site pages to track visitor behavior. It then provides you with many different tools and types of heat maps and enables you to distinguish referral sources for clicks. This add-on is available in a free version for 30 days, and after the trial period ends, the paid plan will start at $24 per month.
The downside of this add-on is that it displays mobile analytics and desktop analytics at the same time, so it may be a bit complicated to use, but it is nonetheless a suitable add-on for tracking the movement of your site visitors.
Add heatmap
The Heatma p add-on provides you with several tools to analyze the behavior of visitors to your site in real time. It uses the color system consisting of (red, yellow, and green). There is no difference between this add-on and other add-ons, except that it offers additional features such as providing detailed information about visitors’ behavior on phones. Smart, which does not affect the speed of the site, and offers high security features as it protects user and visitor data from hackers.
This add-on also offers a free plan, which includes only one website and five web pages, and for paid plans, it starts from $100 per month.
In the following paragraphs, we will explain to you how to install the Hotjar add-on as an example, so that you can understand how Heatmap tools are generally used to analyze the behavior of your site users:
How to install the HotJar plugin on your WordPress website
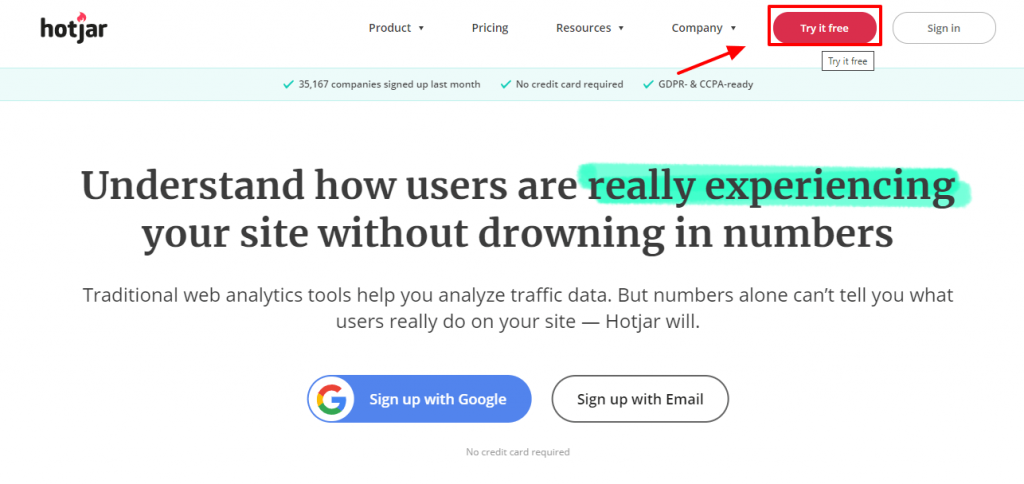
First, you must go to the Hotjar website to add your site, then click on Try it for free .
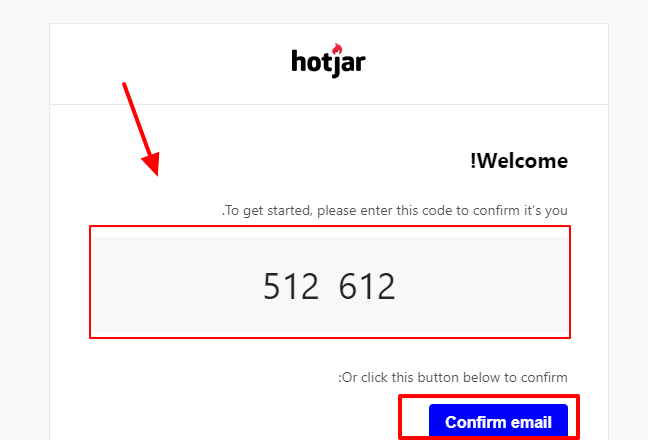
Then enter the information required of you (email and name), or you can use registration with a Google account directly. Then complete the registration steps like any other site you register with. You must confirm the account through the code that was sent to you, or click on ( confirm email ).
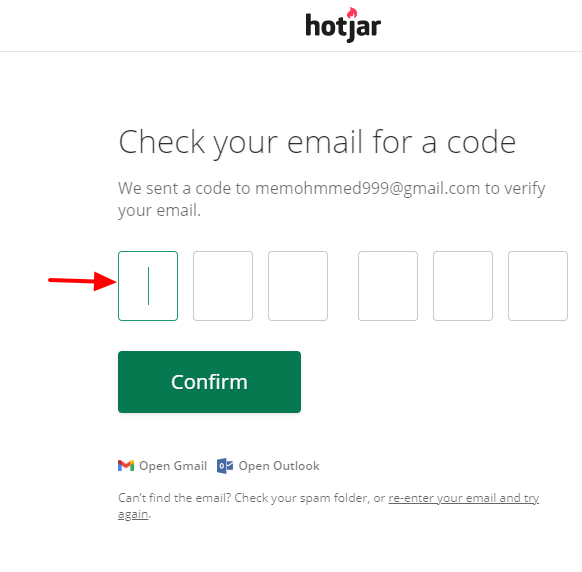
Enter the code that was sent to you as shown in the following image:
After that, you must specify a password for your account, and you can use a password suggested by Google.
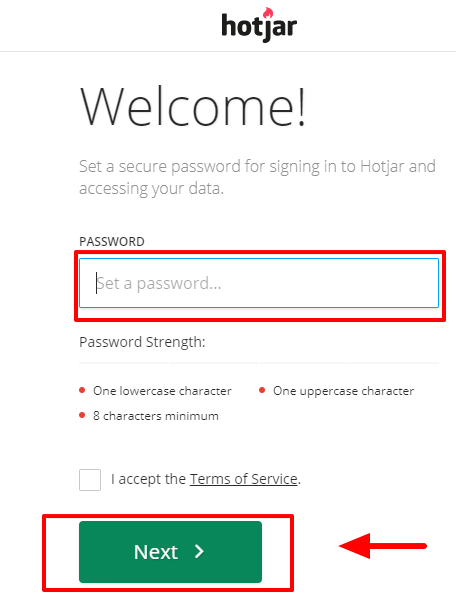
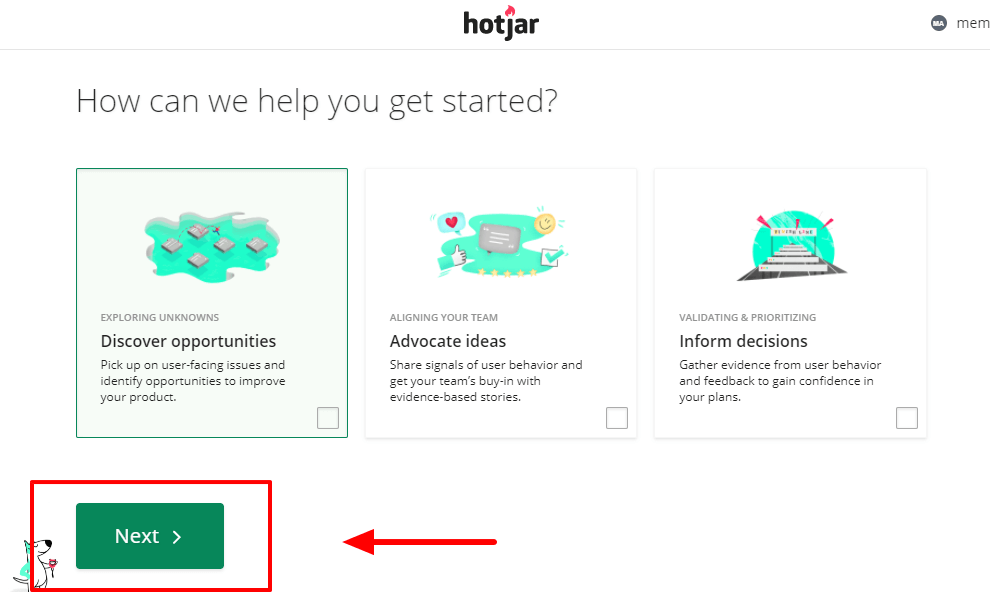
Select the reason you are using the tool, then click Next .
In this step you have to enter the following set of data:
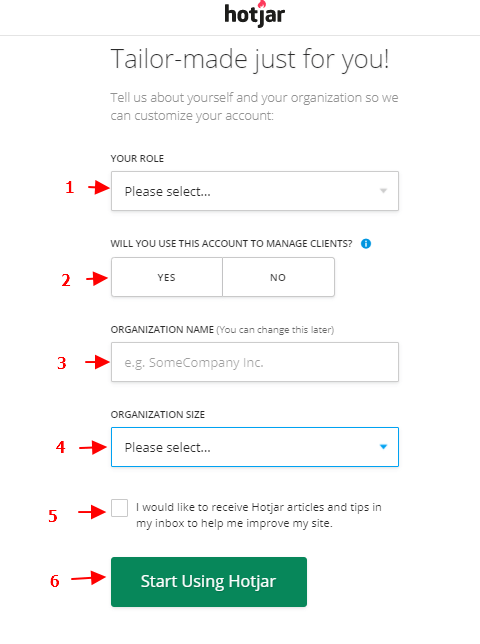
- Job or Role : Select from the drop-down list your job, whether you are a marketer, web developer, analyst, or online store owner.
- Determine whether you are using the account to manage other clients’ sites.
- Enter the name of your project, site or company.
- Select the company size (ORGANIZATION SIZE) : Choose from this drop-down list the size of your company, by indicating the number of workers or employees.
- Activate this option if you want to receive a set of how-to articles from Hotjar via your email.
- Click on (Start Using Hotjar) to move to the next step.
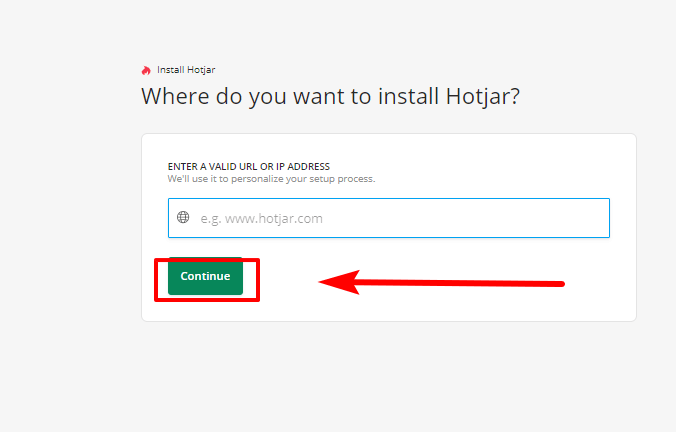
Enter the link to your WordPress website, and click the Continue button .
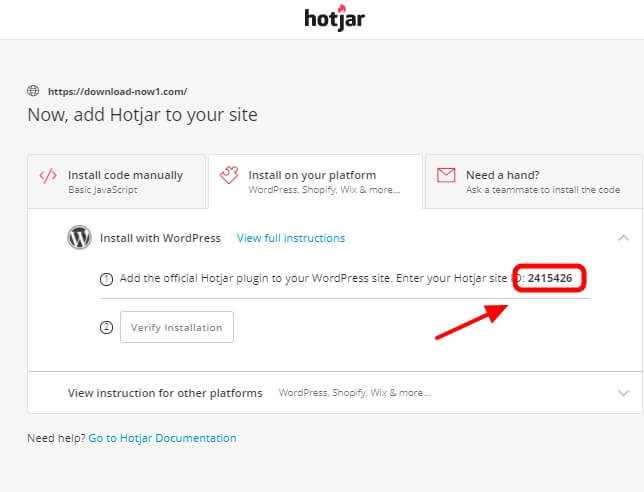
After that, you will have two options to confirm your website, the first is by using the custom code, which is as follows:
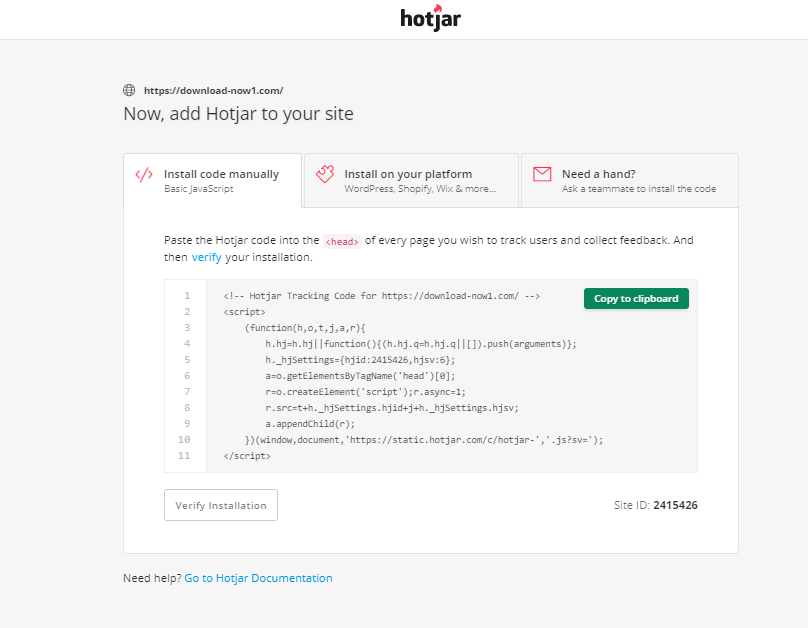
The second is using the Site ID. In this explanation, we will use the Site ID.
Leave the ID as it is for now and move on to the next step (you will need it in the next steps).

Next step: install the Hotjar add-on
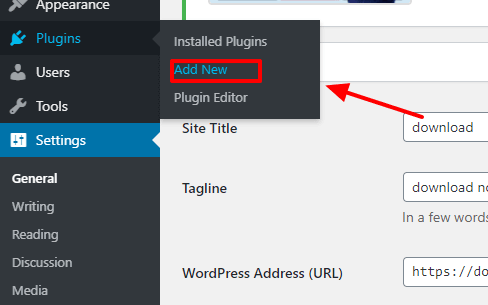
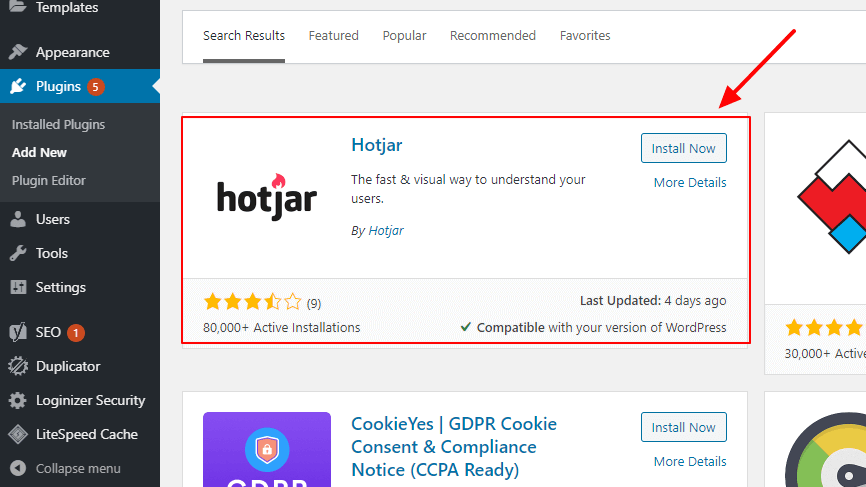
Log in to your site’s control panel, and from the WordPress control panel, choose Plugins and then click Add New.
In the search field at the top, enter “Hotjar” and click Install Now.
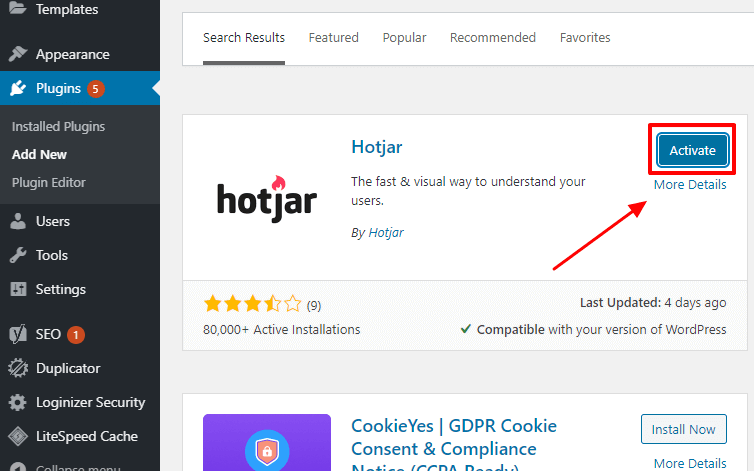
Then click Activate to start using the add-on.
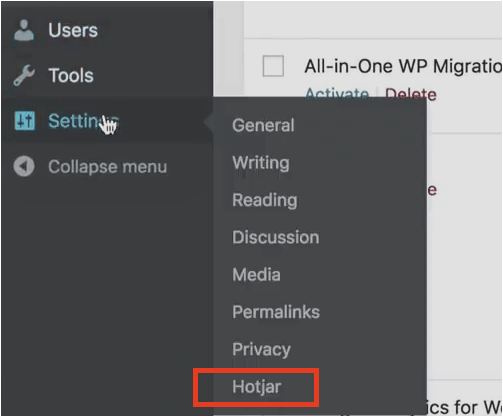
Step Three: Connect the site with Hotjar
In the WordPress control panel, choose Settings , then click Hotjar .
Next, log in to your Hotjar account to view the site added to the widget. Next to the name of the site in question there will be a special identifier, copy it.
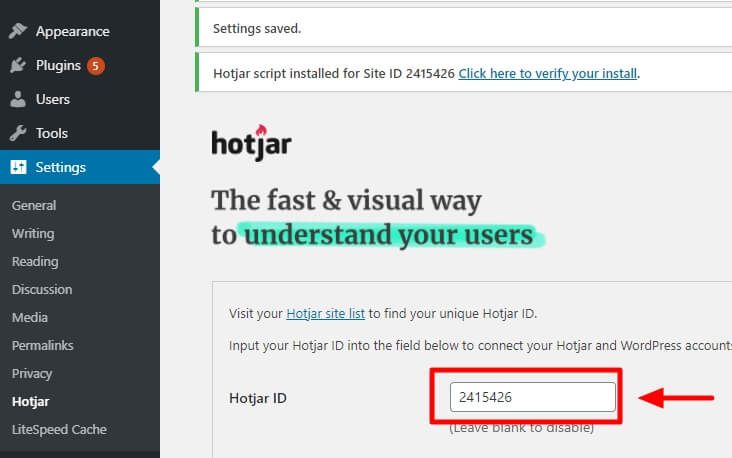
Then paste it in the Hotjar ID field within the extension settings as shown in the following image, and then click on the Save Changes button .
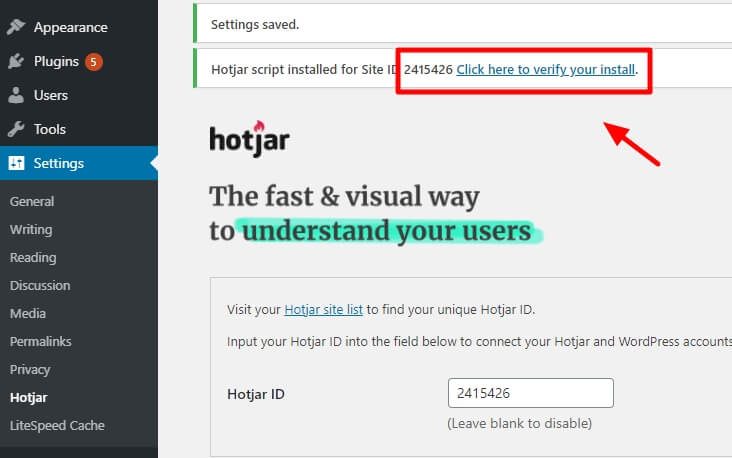
Now click on the verify your install link located at the top of the screen as shown in the following image:
After that, you will see the following window showing you that the installation process has been verified.
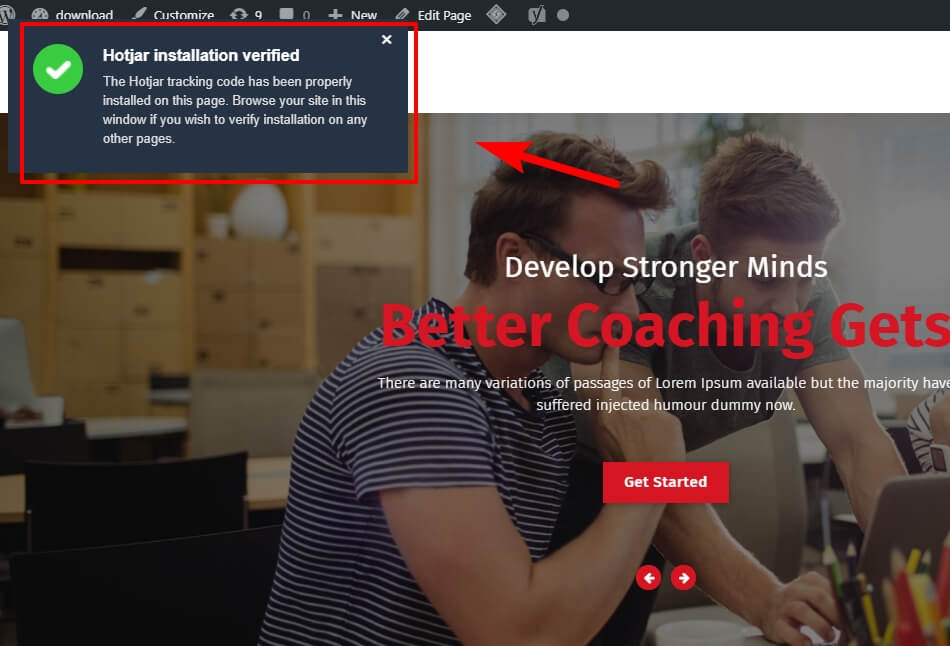
With this, you have finished installing the Hotjar plugin on your WordPress website.
To start using this add-on, log into the add-on control panel and start learning about the behavior of your website visitors through Heatmaps, and creating questionnaires.
common questions
Why should you use heat maps on your website?
To learn about the behavior of visitors to your website, it shows the buttons, sections, and content that are of interest to visitors, through several types of analytics.
Is it necessary to use heat maps?
No, it is not necessary to use heat maps on simple sites. However, in online stores and sales pages, it is necessary to know the behavior of visitors. Here, knowing the length of the session or the bounce rate will not be useful. Rather, we need a way to identify users’ actual behavior on the sales page.
How to read heat map?
The heat map can be read by looking at the colors shown on the map, and through these colors you can identify the parts with a high click rate that are in red. And the parts with a low rate of activity or clicks that may not be of interest to the audience or that they cannot access. When you look at the following image, you can conclude some things:
This image represents the HotJar heat map, specifically of the site’s home page. By looking at the image, you will find that clicking on the top buttons, such as the Pricing button, the try it for free button, and the site login button, have a high click rate compared to the other buttons.
Thus, in this article, we have learned about the concept of heat maps, which are the ideal solution for you to understand how your visitors interact with the website in a visual way that is easy to understand and use. We also learned about the different types of heat maps. Finally, we explained how to activate these maps on WordPress sites, and we reviewed the most prominent plugins that provide you with this feature